
Measurement of the microclimate on a drystone wall / 2021

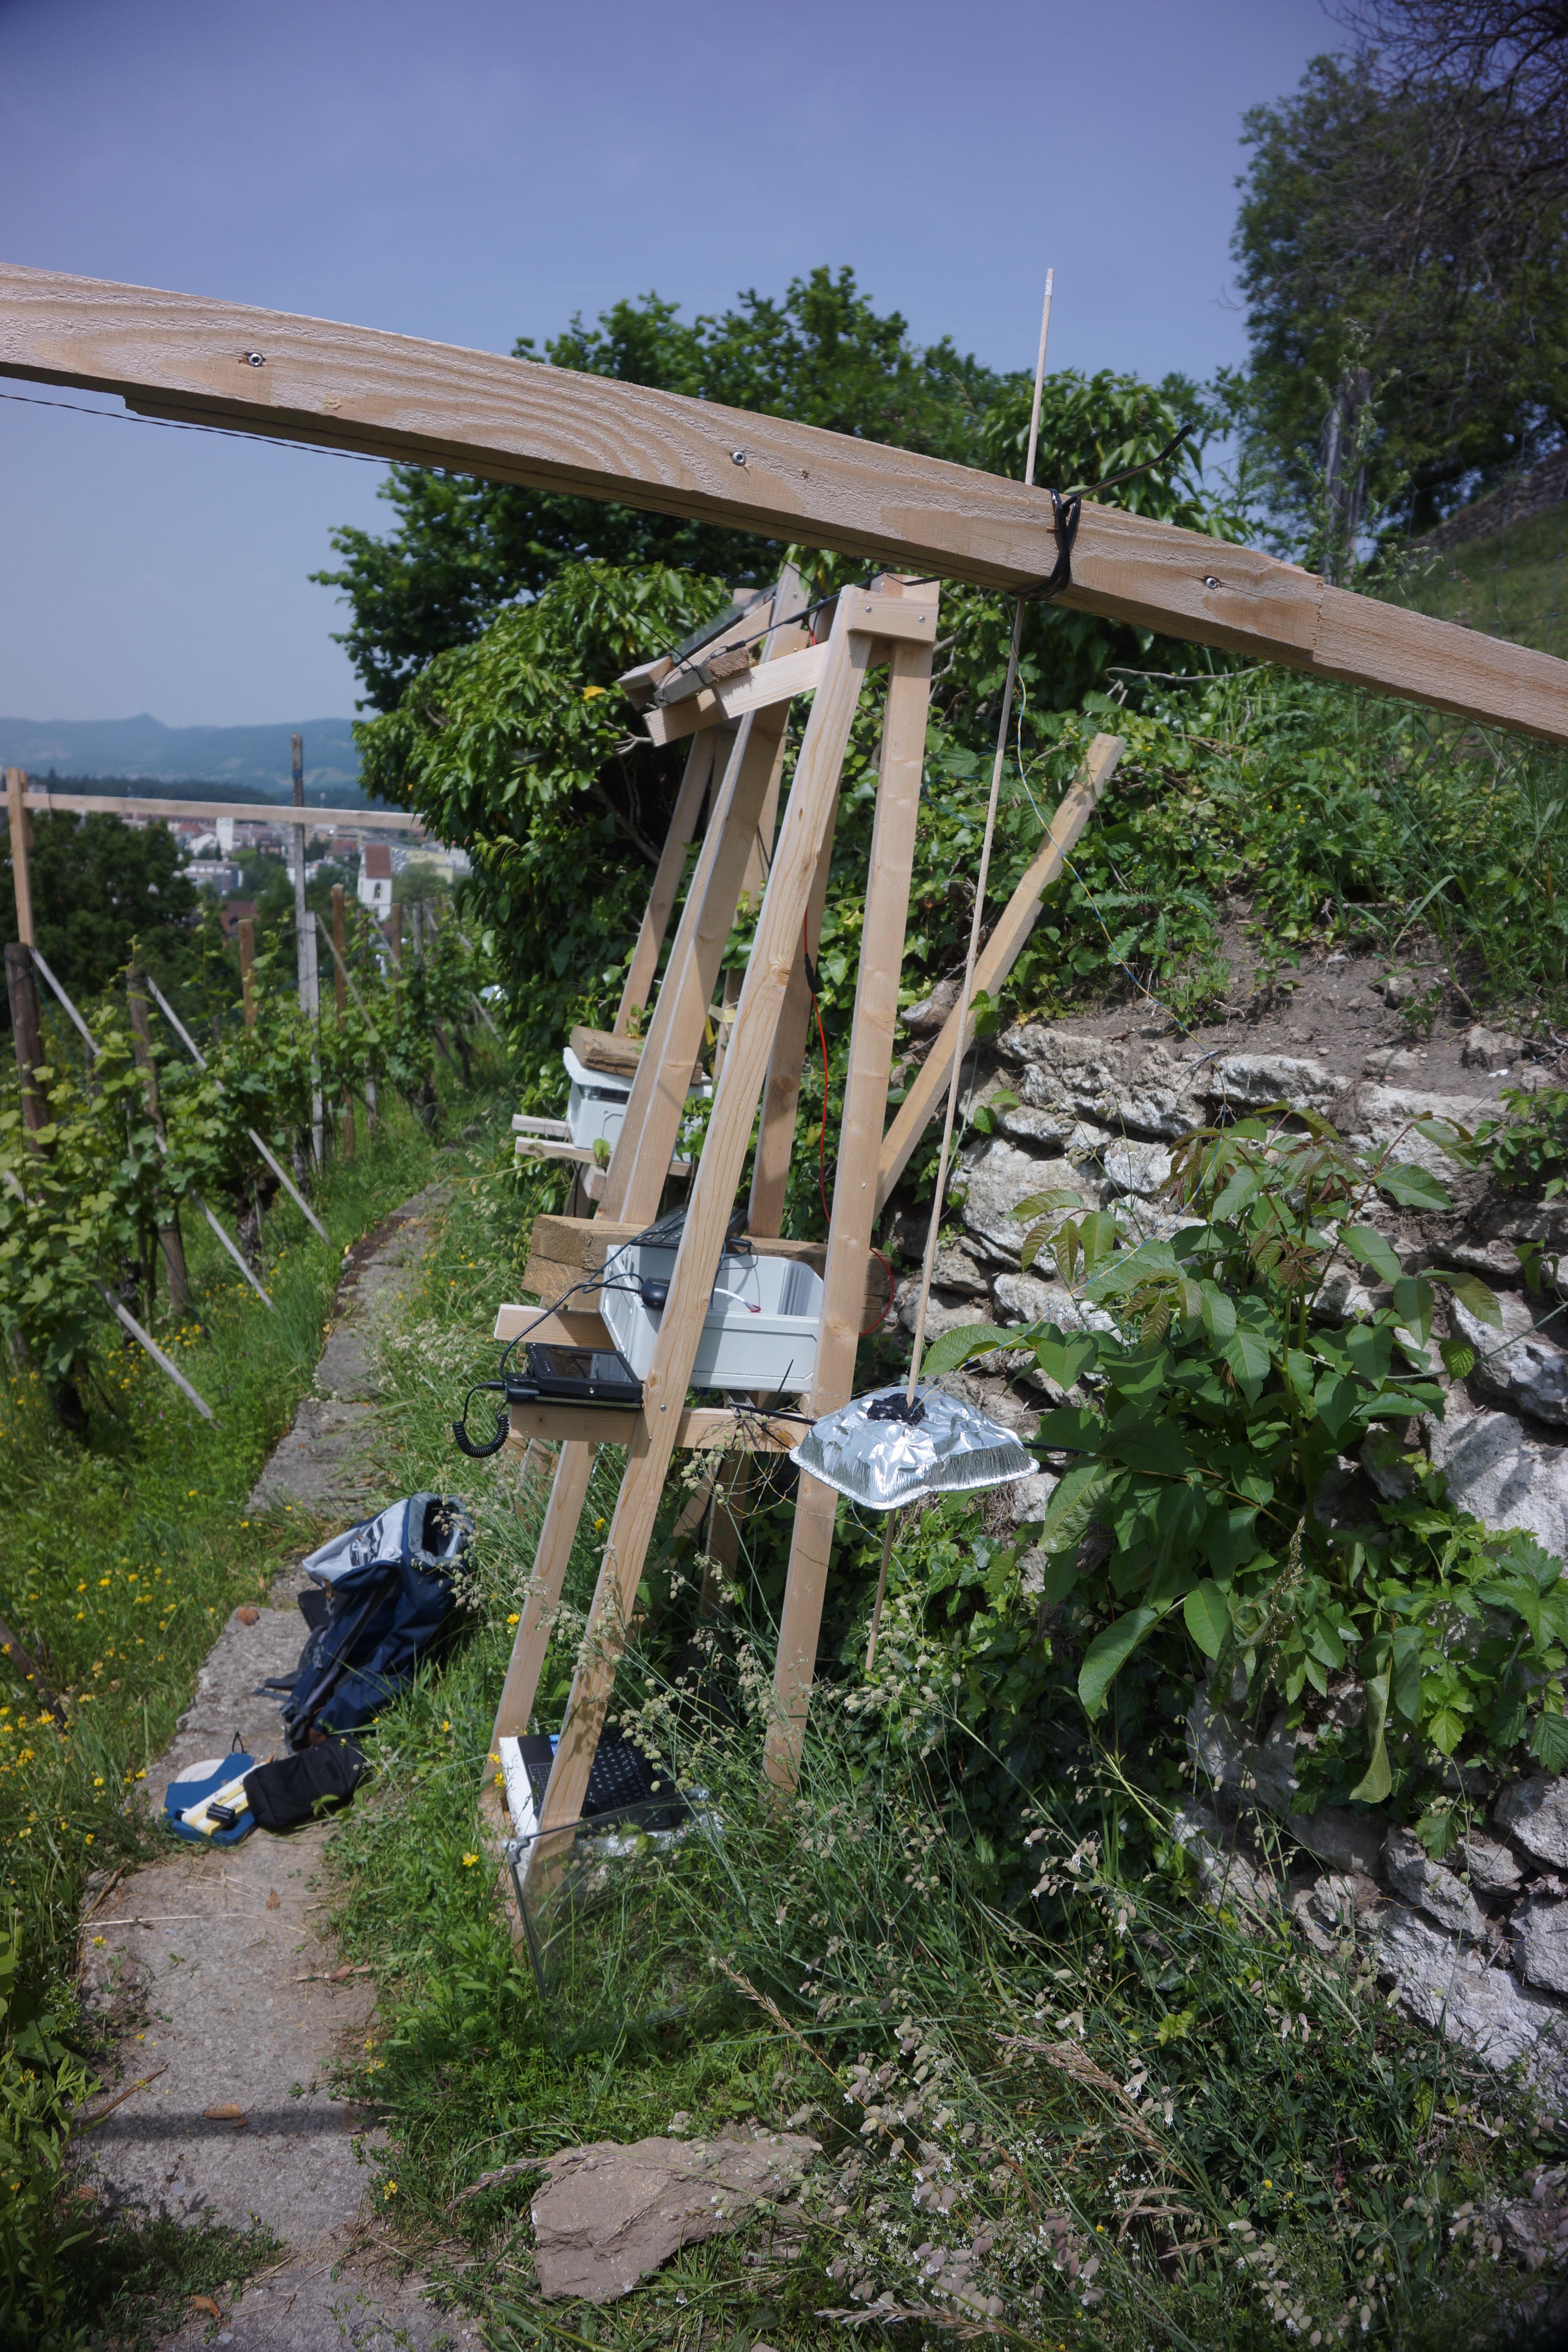
Measurement of the microclimate on drystone retaining walls. Comparison of the climate in front of a wall covered with ivy and an exposed wall. Four temperatures were measured in each case:

  • Wall interior approx. 30-40 cm below the surface.
  • Wall surface
  • Air temperature, distance 1m from the wall surface
  • Air temperature, distance 6m from the wall surface.

The temperatures were measured 4 times per minute, written to a CSV file and the file was saved to Dropbox via modem.

micclim_measurement

DIAGRAMS

  • Overgrown drystone wall: GREEN CURVE
  • Bare drystone wall: YeLLOW CURVE
  • Average Temperature Lenzburg (Meteoblue): BLUE CURVE

For the diagrams, the measured values of the 3 hottest days were evaluated (13 - 15 August 2021).

Interpretation of the diagrams:

The greater the deviation of the green and yellow curves, the greater the influence of the vegetation on the wall.

It can be seen that the measured values at a distance of 6 m from the wall are almost identical. The influence of the wall on the temperatures is not recognisable here. This may be due to the fact that at warm temperatures thermals cause air to rise from below.

In the immediate vicinity of the wall, the temperature differences are considerable. While the uncovered wall reached temperatures of over 40 degrees, the temperatures under the vegetation never rose above 33 degrees.

The inside of the wall also shows differences: With the exposed wall, the heat slowly moves inwards and a temperature maximum is reached around midnight. With the overgrown wall, the temperatures inside the wall are largely constant.

The greater the deviation of the measured values (green and yellow) from the mean temperature (blue), the greater the influence of the local microclimate.

Comparing the measured values with the mean temperature of Lenzburg (Meteoblue), it becomes clear that the curves of the measured values are most similar at a distance of 6m from the wall. The closer to the wall the measurements are taken, the greater the deviation (regardless of whether they are overgrown or exposed). This indicates that the wall (with or without vegetation) has a great influence on the microclimate within a radius of 1-2m (-> trellis trees).

Diagram 1, Temperatures inside the wall

In the case of the exposed wall, the heat slowly moves inwards and a temperature maximum is reached around midnight. With the overgrown wall, the temperatures inside the wall are largely constant.

MicClim01

Diagram 2,  Temperatures on the wall surface

In the immediate vicinity of the wall, the temperature differences are considerable. While the surface of the uncovered wall reached temperatures of over 40 degrees, the temperatures under the vegetation never rose above 33 degrees.

BLG_Mess2

Diagramm 3, Air temperatures at a distance of 1m from the wall surface.

The influence of the wall on the air temperature is not clearly recognisable

MicClim03

Diagram 4, Air temperatures at a distance of 6m from the wall surface.

There is no discernible influence of the wall on the air temperatures.

BLG_Mess4